Nationwide, existing home sales were down slightly in August, falling 2% after two consecutive months of increases, according to the National Association of REALTORS®. The decline in existing home sales coincides with rising sales prices, which have continued to soar into fall, with the median sales price of existing homes up 14.9% compared to last year. Declining affordability has had a significant impact on homebuyers, many of whom have been priced out of the market and are choosing to wait for sales prices to ease before resuming their home search.
Closed Sales decreased 11.3 percent for Residential homes and 15.2 percent for Condo homes. Pending Sales decreased 9.7 percent for Residential homes and 9.8 percent for Condo homes. Inventory decreased 15.6 percent for Residential homes and 34.3 percent for Condo homes.
The Median Sales Price increased 9.3 percent to $236,000 for Residential homes and 12.0 percent to $215,000 for Condo homes. Days on Market decreased 54.0 percent for Residential homes and 52.7 percent for Condo homes. Months Supply of Inventory decreased 19.0 percent for Residential homes and 42.9 percent for Condo homes.
There are signs the market may be shifting, however. New listings have continued to hit the Market, bucking seasonality trends were commonly seen in the fall, a time when listing and sales activity typically slows as children return to school. As inventory increases, competition for homes may soften, and could even bring moderation in sales prices, which, after 114 months of year-over-year gains, would be music to the ears of homebuyers throughout the country.
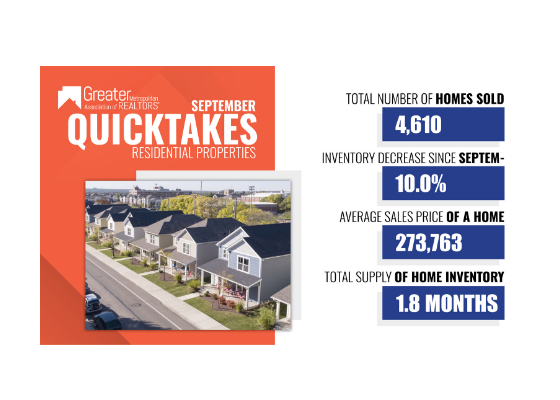
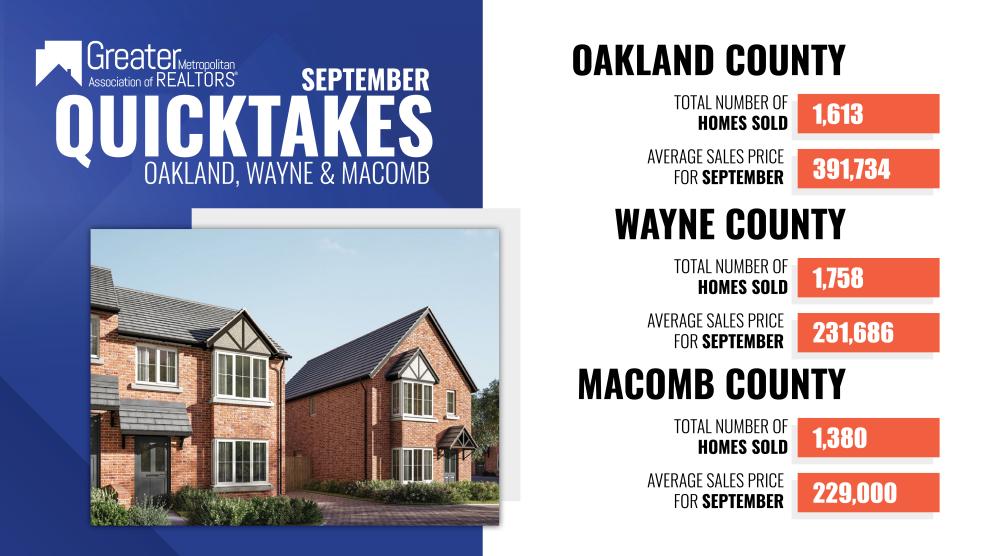
September Year-Over-Year Res & Condo (Combined) Quick Comparisons:
- Median Sale Price was up by 8.9% from $214,900 to $234,000.
- The average days on market (DOM) decreased by 52.9% from 51 to 24 days.
- The average % of the last list price received increased by 1.4% from 99.2% to 100.6%.
- New Listings decreased by 3.7% from 15,269 to 14,704.
- Average Showings per Home decreased from 10 to 9.5.
- Pending Sales were down by 9.7% from 12,932 to 11,675.
- Closed Sales were down by 11.8% from 13,850 to 12,220.
- Listings that were both listed and pended in the same month were at 5,639. This represents 38.4% of the new listings for the month and 48.3% of the pended listings.
- Months-Supply of Inventory was down by 22.7% from 2.2 to 1.7.
Download GMAR's September 2021 Housing Statistics. For more stats, please visit our resource library.
